


For decades, plant biologists have relied on traditional scientific methods for clues into how plants function. Genetics, molecular biology, and biochemistry have allowed us to infer the mechanisms that underpin plant life. These tools are invaluable, but new high-resolution microscopy techniques are revolutionising our understanding of plant life.
These aren’t any old microscopes. High-resolution microscopy allows researchers to observe biological processes in real-time, inside living plant cells, with astonishing spatial and temporal resolution. The dynamic, inner life of cells is now observable.
These amazing new techniques were on display at the Flora in Focus conference, which I had the privilege to attend at Oxford Brookes University on the 7th January 2026. Not only did I see a lot of beautiful images, but I witnessed first-hand how imaging is being transformed from a descriptive tool to a very quantitative, hypothesis-driven science.
In this article, I’ll highlight some of the key insights I took away from this conference.
From pretty pictures to biological insight: microscopy makes sense of complexity when combined with the right analytical tools
Much of modern plant biology is built on fluorescence microscopy. In short, a fluorescent protein – originally derived from jellyfish – is attached to a protein of interest. Scientists then use microscopes specially equipped with lasers to see their protein of interest inside living plant tissue. Using the fluorescence, scientists can then determine where the protein sits in the cell, and importantly, what it might be doing.
At Flora in Focus, Professor Mark Fricker from the University of Oxford illustrated this beautifully through his work on the plant endomembrane system. This interconnected network of membranes – including the web-like endoplasmic reticulum (ER) and the Golgi apparatus – is present in in all eukaryotic cells and has the important function of producing, processing, packaging, and distributing proteins throughout the cell. Fricker uses fluorescent tagging and confocal microscopy (a special type of fluorescence microscopy) to study the ER.
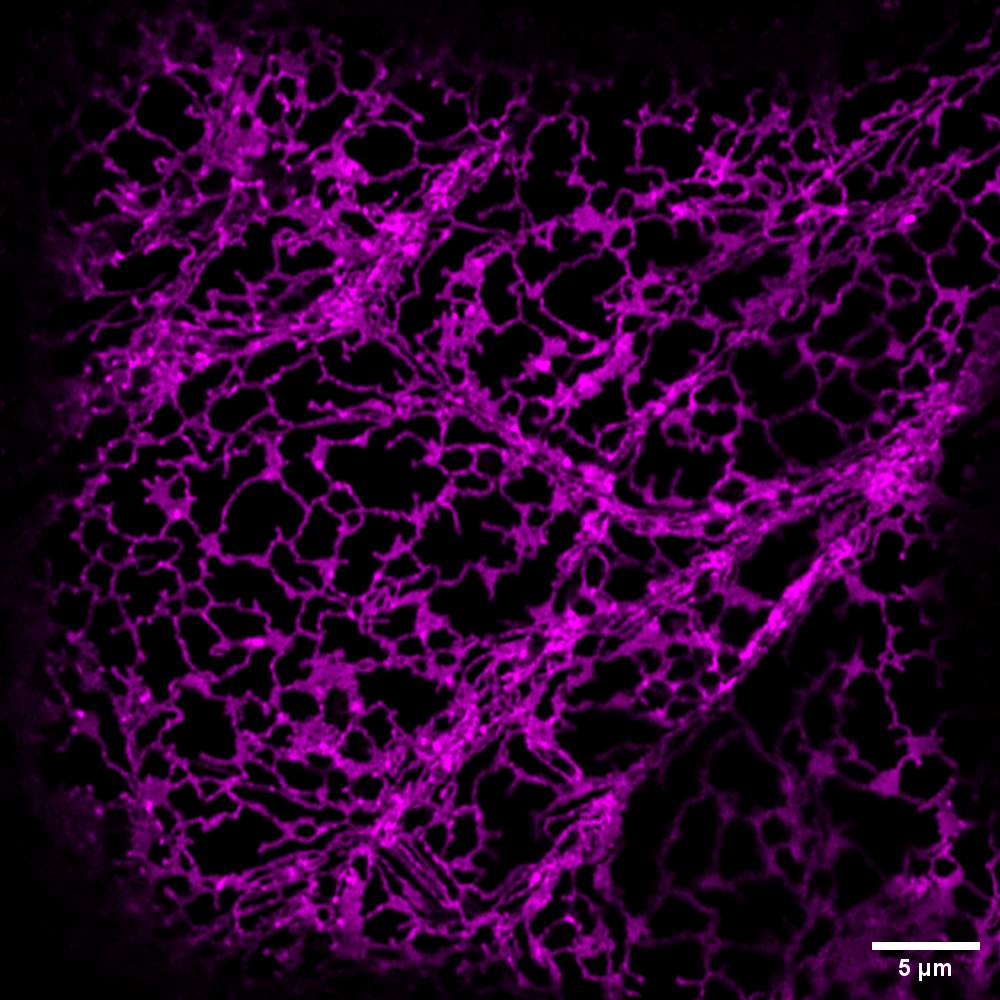
As you can see, a single confocal image of the ER can be mesmerising. But one picture can’t tell the whole story of a protein’s function. To gain more information, scientists compare many images, across different conditions, genotypes (plants containing similar but different genes), or developmental stages (e.g. young vs old leaves). But interpreting all of those images can quickly become subjective when measured with the naked eye.
To tackle this, Fricker spoke about an automated image analysis software that he and Dr Charlotte Pain (Oxford Brookes University) developed, called AnalyzER. AnalyzER converts ER images to quantitative data by extracting measurable parameters describing ER structure, allowing researchers to compare networks objectively across experiments.
In her 2019 paper, titled ‘Quantitative analysis of plant ER architecture and dynamics’, Pain highlights the “wealth of information needed to characterise the structure and dynamics of the ER, and how these change with experimental treatments”, emphasising how tools like AnalyzER can shift microscopy from illustration to analysis. Such quantitative analyses have become crucial elements of modern microscopy.
From static images to measuring motion: time lapse photography can show functional movements inside the cell
Static images, however detailed, hide crucial information. A single snapshot of a cell cannot tell us whether proteins are stationary or mobile, stable or transient, or reveal how the proteins functionally interact with each other. Time-resolved images solve this problem by capturing a series of images in quick succession, before they are pieced together into a short movie. Dr Joanna Chusteki of the University of Oxford demonstrated the power of this approach in her work on mitochondria.
Mitochondria are small, rounded organelles responsible for energy production in cells through aerobic respiration. Using fluorescent mitochondrial markers, Chusteki tracks the behaviour of individual mitochondria within single living plant cells. Rather than sitting stationary, she sees them zipping around the cell – dividing, fusing, and repeatedly coming into contact with one another. She questioned “why would the plant invest so much energy in moving these organelles around?”
To answer this, Chusteki explained to me how she used graph theory to “track the exact positioning and connectivity of each individual in the cell [and build] a positional and connectivity map of the whole population”. Mapping this ‘social network’ showed that mitochondria move and connect differently under stressed growth conditions, with the goal of sharing proteins, metabolites and mitochondrial DNA to meet the metabolic and energetic needs of the cell.
Looking at the mapped social network was like glimpsing each mitochondrion’s personal history, revealing the otherwise invisible choreography of these organelles.
The Dance of the Mitochondria, as observed in Arabidopsis plant cells, in the paper by Chustecki, J., Gibbs, D., Bassel, G., and Johnston, I. (2021) Network analysis of Arabidopsis mitochondrial dynamics reveals a resolved tradeoff between physical distribution and social connectivity. Cell Systems, 12(5), pp. 419-431.e4. Available at: https://doi.org/10.1016/j.cels.2021.04.006. CC BY 4.0
‘Photoswitches’: bulk protein movement can be followed inside the cell using a fluorescent light switch
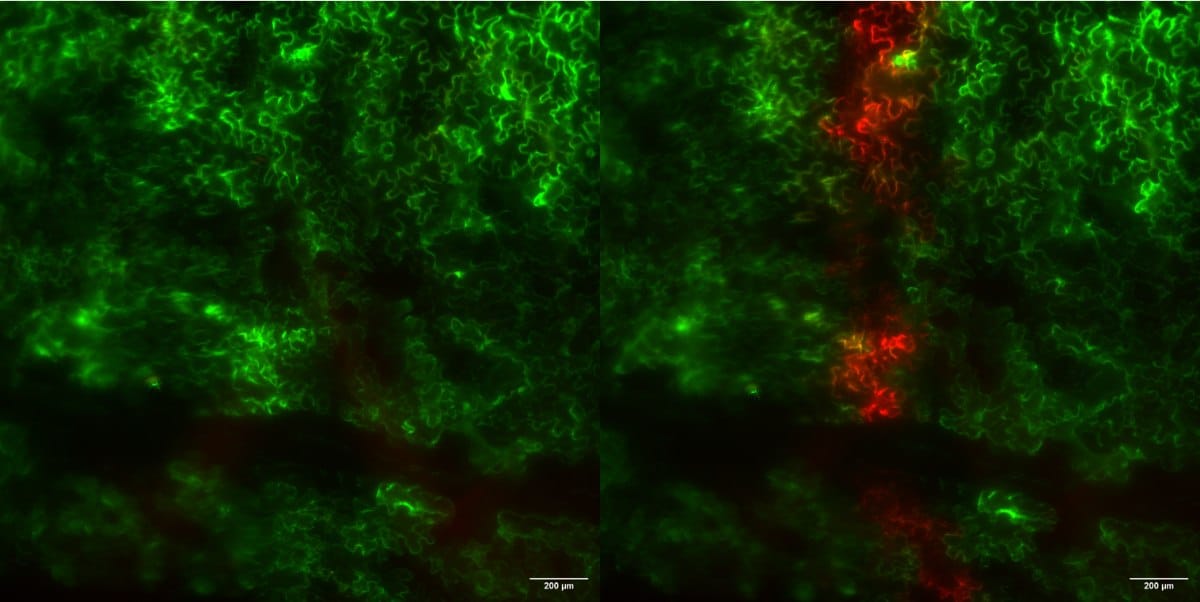
While time-lapse imaging can capture protein movement, it cannot measure the rate of protein production over time within a cell. To do that, Dr Charlotte Pain presented a powerful optical approach, using a photoconvertible fluorescent protein called Kaede.
Kaede is an irreversible photoswitch. Under normal conditions, it fluoresces green. However, when exposed to UV light, its molecular structure changes and it fluoresces red. This optical trick effectively freezes cells in time: every Kaede-tagged protein present at the time of the UV pulse shines red, but every Kaede-tagged protein produced after the UV pulse will shine green, having never experienced the UV light.
Researchers can use this ‘pulse-chase’ tool to follow protein production in real time through the endoplasmic reticulum. Over time, as newly produced proteins move through the ER, the ratio of green to red proteins increases in direct proportion to the rate of new protein production. This allows scientists such as Pain to measure how quickly a particular protein is made under different growth conditions (e.g. salty soil vs normal) or in different genotypes (e.g. salt tolerant or non-tolerant rice varieties). Although the system is still being optimised, it highlights the growing power of optogenetic and photoconvertible tools in plant cell biology.
Going beyond the light: X-rays mark the spot when combined with plant imaging
Not all biological questions can be answered using fluorescence. Professor Gail Preston from the University of Oxford showed how imaging techniques beyond traditional light microscopy can reveal entirely new aspects of plant biology.
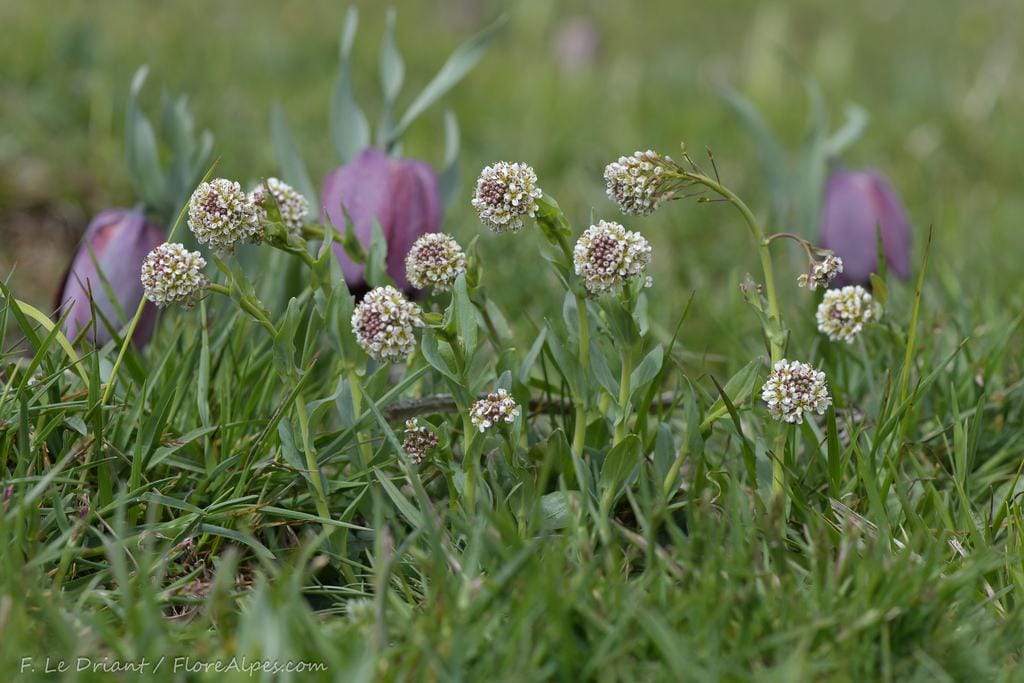
She discussed her work on Noccaea caerulescens, a small plant with an extraordinary ability to grow in metal-rich soils. N. caerulescens not only thrives in these conditions, but appears to depend on them. When grown in low-metal soils, they become susceptible to attack by pathogens such as powdery mildew. This suggests that metals are being used by the plant as a defence mechanism.
To understand how the plants use metals, particularly zinc, in defence, Preston wanted to look at where it was accumulating within the plant. To answer this, Preston’s team used high-energy X-ray fluorescence (XRF) microscopy to visualise zinc distribution within intact plant tissues. When atoms in the sample were hit by X-rays, they emitted secondary X-rays with element-specific signatures, allowing precise mapping of metal localisation.
Dr Rose Bourdon, a PhD student who worked on the project, told me how insightful this technique is.
“Unlike perhaps the more familiar ‘bulk’ techniques, where samples are homogenised and analysis provides an overall quantification of the elemental composition, XRF imaging preserves the spatial information, so we can map the distribution of metals throughout the sample.”
Crucially, this tells us where the zinc is accumulating, not just that the metal is present.
Preston and colleagues grew N. caerulescens plants in metallic soils and analysed zinc distribution in both plants that were infected and not infected with a bacterial pathogen. Using X-ray fluorescence microscopy, Preston and her group found that zinc co-localised with other plant defences during infection, opening up a mechanistic explanation for how zinc helps plants in the face of danger.
It struck me how clever these specialised plants are — they use metals that would kill other plant species to their own advantage. It also struck me how this powerful technology has enormous potential in understanding the chemistry behind plant immune responses, and how we might be able to make other plants more resilient to their pathogens.
Focussing on the Future in Flora
Flora in Focus showcased just how far high-resolution microscopy in plant biology has come, spanning scales from individual organelles to whole plants. Across these levels, modern imaging is revealing plant life with unprecedented clarity, capturing not only where biological components are, but how they move, interact, and change over time.
Crucially, the conference highlighted that images alone are not enough to understand the inner life of plants. Quantitative analysis is essential for turning pretty pictures into biological insight.
Read more about analyzER here: Pain, C., Kriechbaumer, V., Kittelmann, M., Hawes, C., and Fricker, M.(2019) Quantitative analysis of plant ER architecture and dynamics. Nature Communications, 10(1). Available at: https://doi.org/10.1038/s41467-019-08893-9.
Read more about mitochondrial connectivity here: Chustecki, J., and Johnston, I. (2024) Collective mitochondrial dynamics resolve conflicting cellular tensions: From plants to general principles. Seminars in Cell & Developmental Biology, 156, pp. 253-265. Available at: https://doi.org/10.1016/j.semcdb.2023.09.005.
Read more about photoswitches here: Brown, S., Bolte, S., Gaudin, M., Pereira, C., Marion, J., Soler, M., and Satiat‐Jeunemaitre, B. (2010) Exploring plant endomembrane dynamics using the photoconvertible protein Kaede. The Plant Journal, 63(4), pp. 696-711. Available at: https://doi.org/10.1111/j.1365-313x.2010.04272.x.
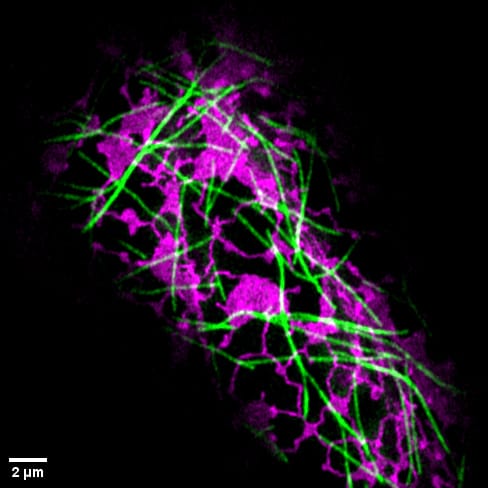
Cover photo: This image, taken with a confocal microscope, shows a Nicotiana tabacum leaf epidermal cell co-expressing two fluorescent protein markers. The microtubule cytoskeleton is visualised in green (GFP-TUA), while the endoplasmic reticulum appears in magenta (BFP-HDEL).