

The advent and breadth of bioinformatics resources have made scientist’s jobs easier. Before jumping into wet lab work, they are able to parse gene targets and construct better hypotheses. Several groups and research institutes have taken the initiative to provide datasets, tools, algorithms, open source code, and visualization platforms.
A comprehensive study of a gene or protein requires enlisting multiple online tools, databases, and visualization platforms. For instances, Araport or TAIR for retrieving information regarding annotation and sequence, BioGRID for protein-protein interaction data, SUBA4 for tracking subcellular localization, AtPAN2.0 for detecting transcription factor (TF) binding sites, Phyre2 for 3D modeling of proteins, and the Reactome for signaling, metabolic, and gene regulatory pathways. In addition, numerous tools exist to analyze post-translational modification (phosphorylation, acetylation, myristoylation, etc.), sub-cellular targeting sequences, functional domains, and small molecule–protein interactions.
These tools and resources also focus on a specific plant in the majority cases. As a result, to check the functionality of a particular protein or domain from an inter-species perspective requires several databases. For this purpose, pulling data from one tool and running it on a different platform requires re-processing or precisely formatting it for the next tool. Integration of multiple tools in a single platform is an elegant solution to avoid work and hassle. Integration is a way for these tools to more easily generate and test hypotheses they were meant to facilitate in the first place.
Introducing the integrated platform ePlant
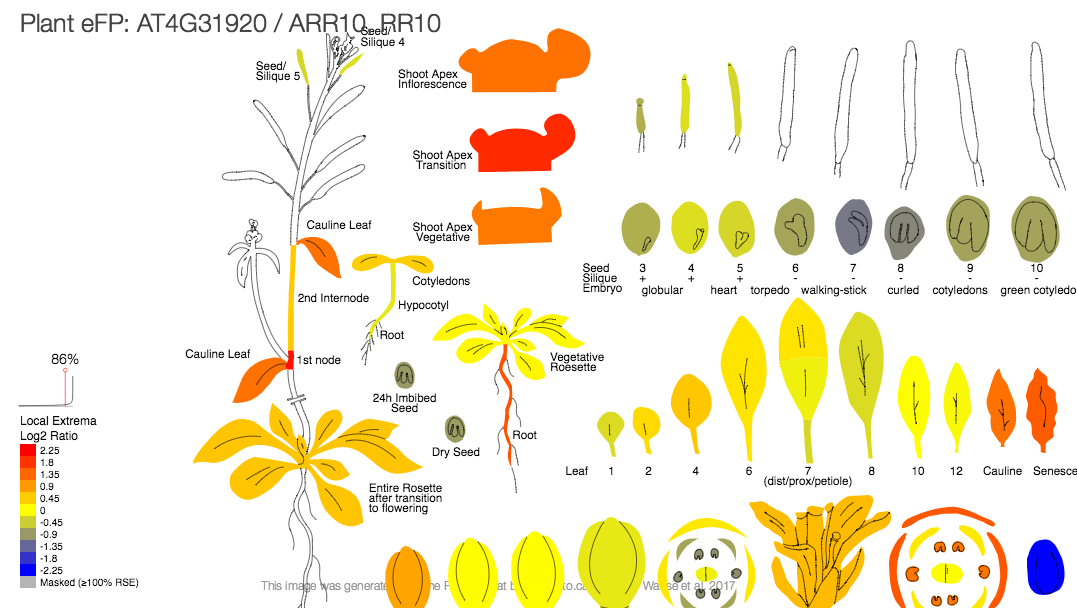
ePlant brings multiple data visualization platforms into one interface based on a hierarchical scale. It integrates several databases and has a zoomable user interface. ePlant has integrated a gene information viewer, publication viewer, heat map viewer, the world eFP (electronic fluorescent pictograph) viewer, plant eFP, tissue & experiment eFP viewer, cell eFP, chromosome viewer, interaction viewer, molecule viewer, sequence viewer, and has link-out options to other tools like Araport, TAIR, SUBA3, MASCP, Biomart etc. Rather than serving solely as visualization tools, they help to answer scientific questions.
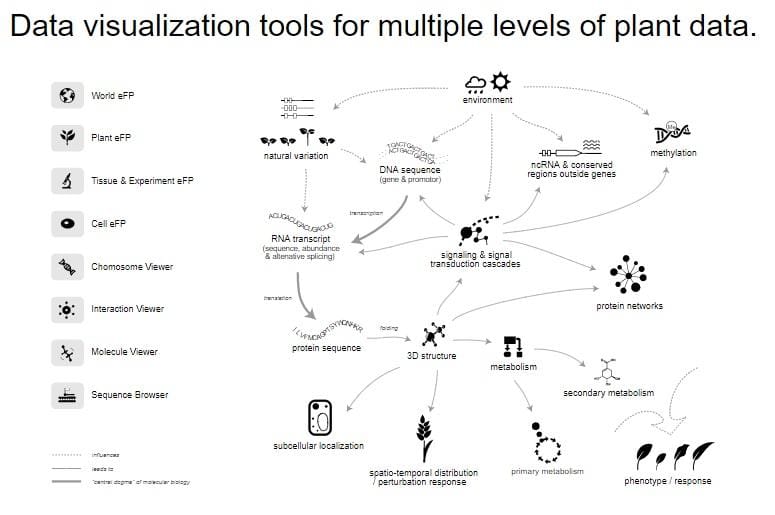
For a particular gene, ABA INSENSITIVE 3 (ABI3), the world eFP viewer shows the variance of gene expression in different ecotypes. The tissue & experiment eFP viewer reveals root specific expression, the cell eFP viewer shows nucleus-specific abundant localization, the chromosome viewer contains the physical map location of the locus, the interaction viewer displays both predicted and confirmed protein–protein and protein–DNA interactions, the molecular viewer pinpoints DNA binding sequence of ABI3 from the partial 3D structure.
Taking ePlant beyond Arabidopsis
ePlant is based on Arabidopsis thaliana data. It contains information for more than 35 million gene expression measurements and experimentally documented subcellular localizations for 10,910 proteins. Additionally, it curates approximately 100,000 protein–protein and 2.7 million protein–DNA interaction data. It also provides Phyre2-predicted structures of 23,091 gene products, and 6.19 million non-synonymous SNPs based on the 1001 Proteomes website.
Although ePlant is dedicated to Arabidopsis thaliana, the entire source code of the project in available in GitHub. Similar platforms are possible to build for any other plants through incorporating appropriate datasets. At the same time, eFP browsers are available for other dicots (Poplar, Medicago, Soybean, Potato, Tomato, E. salsugineum, C. sativa, Arachis, Grape), monocots (Maize, Rice, Barley, Triticale, Brachypodium), and non-plants (Mouse, Human) in BAR (The Bio-Analytic Resource for Plant Biology) platform along with ePlant. Looking at gene expression in Arabidopsis can lead to insights about how it functions in other plants. In this way it helps to broaden the application of a researched gene or gene regulatory network in multiple plant species. Integration of wide array of species for eFP viewer enables researchers to explore interesting patterns in different experimental systems.